Dashboards & KPIs
General Widget Capabilities
-
Almost every widget is available in two display formats: a table view, which shows the exact records included in the selection, and a chart/diagram view, which visualizes the same data.
-
Each widget has its own set of filters, and the applied filter settings are saved for that widget.
-
Data in each widget can be filtered both statically (a fixed date or value range) and dynamically (a relative/rolling period), so numbers update automatically to stay current without needing to be re-filtered manually each time.
Please note: The screenshots below do not show both formats for each widget. For some widgets, only the table view is shown; for others, only the chart view. This is for illustrative purposes only and does not mean that a widget is limited to a single display format. As noted above, each widget supports both table and chart views.
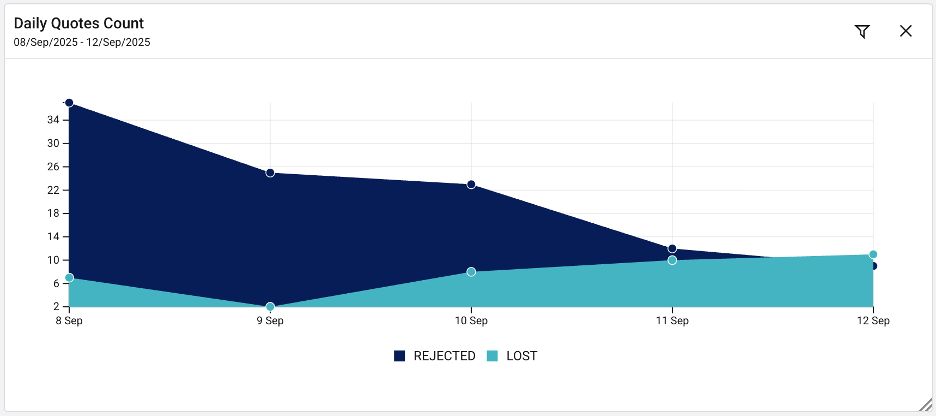
Daily Quotes Count
Shows the number of enquiries created within a given time period.
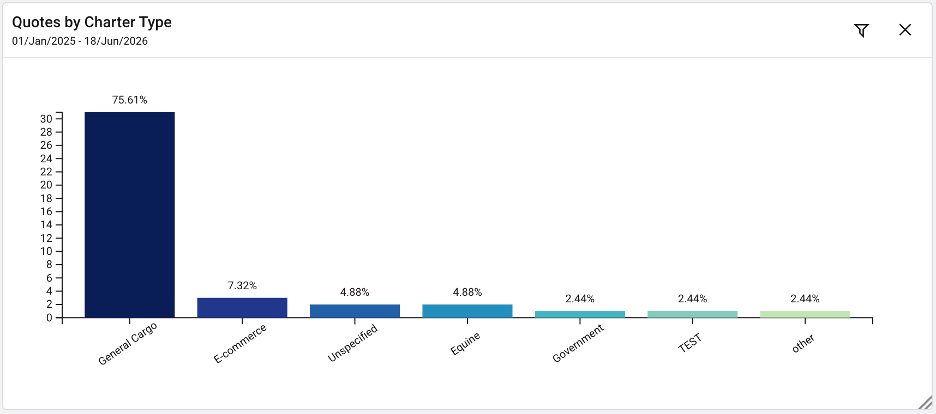
Quotes by Charter Type
Shows the number of inquiries created during the selected period, broken down by charter type.
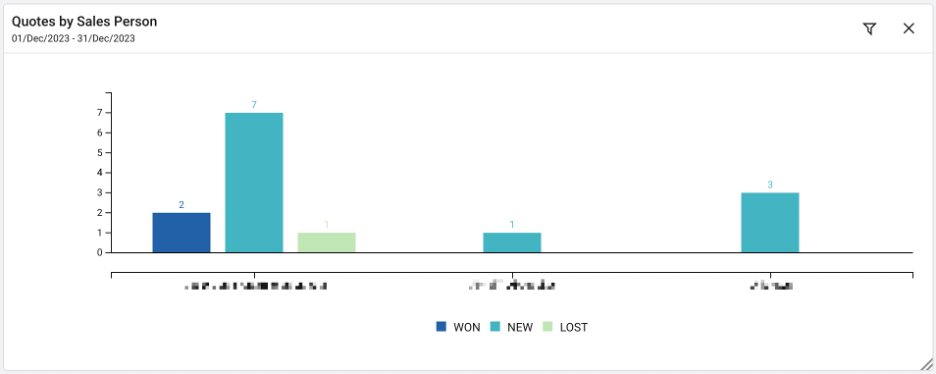
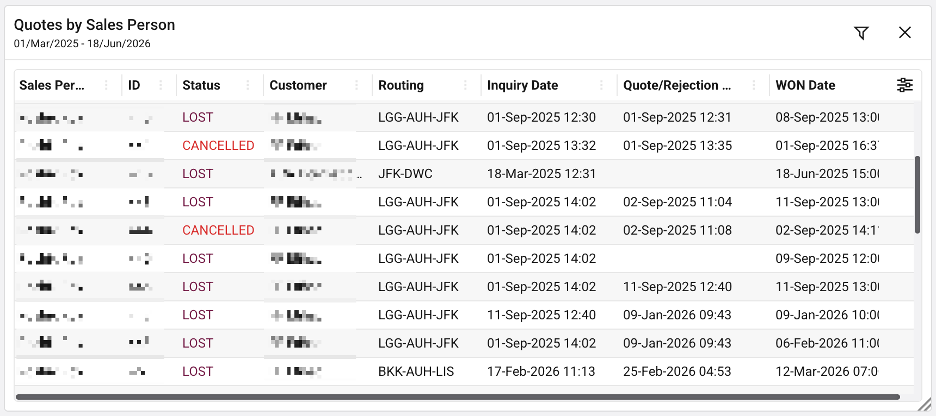
Quotes by Salesperson
Shows the number of inquiries created during the selected period, broken down by salesperson (broker).
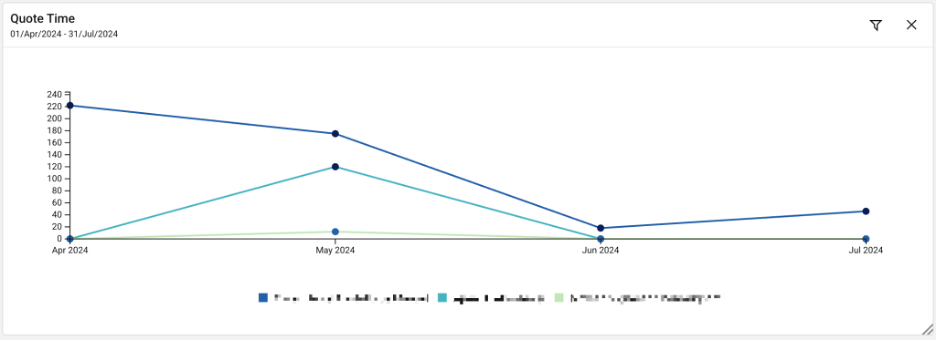
Quote Time
Time elapsed from receiving an enquiry to providing the customer with a quote.
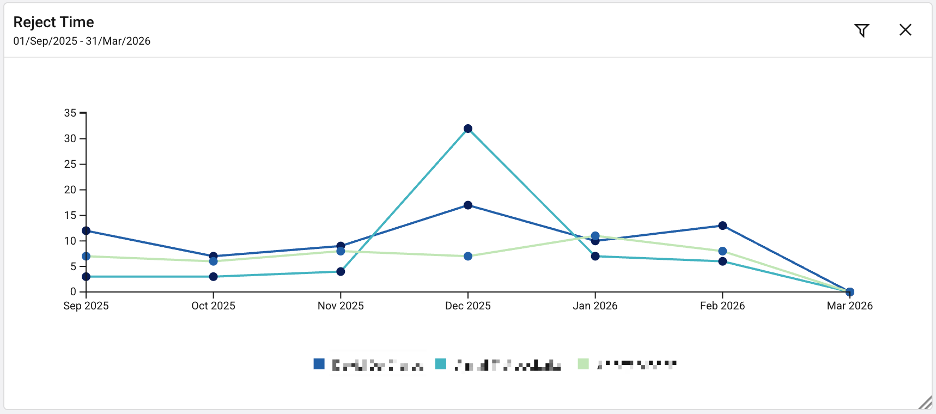
Reject Time
Time elapsed from receiving an enquiry to rejecting it.
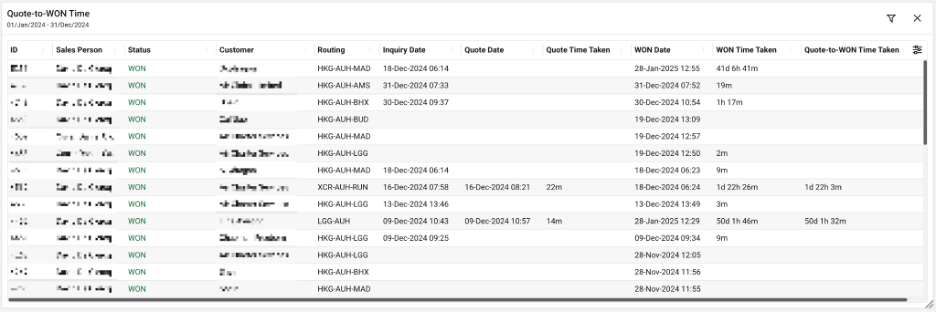
Quote-to-WON Time
Time elapsed from providing the customer with a quote to winning the enquiry.
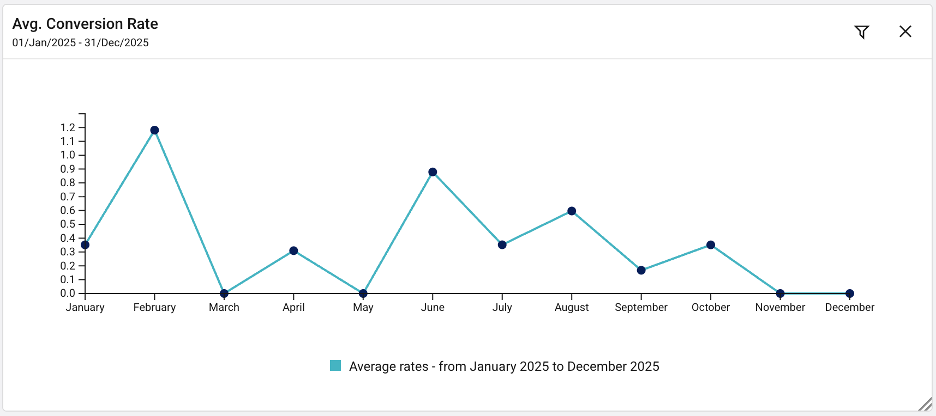
Avg. Conversion Rate
The average conversion rate of WON requests relative to total requests.
Formula: (("WON" + "QUOTE ACCEPTED") / ("QUOTED" + "LOST" + "QUOTE NEGOTIATION" + "CANCELLED")) × 100
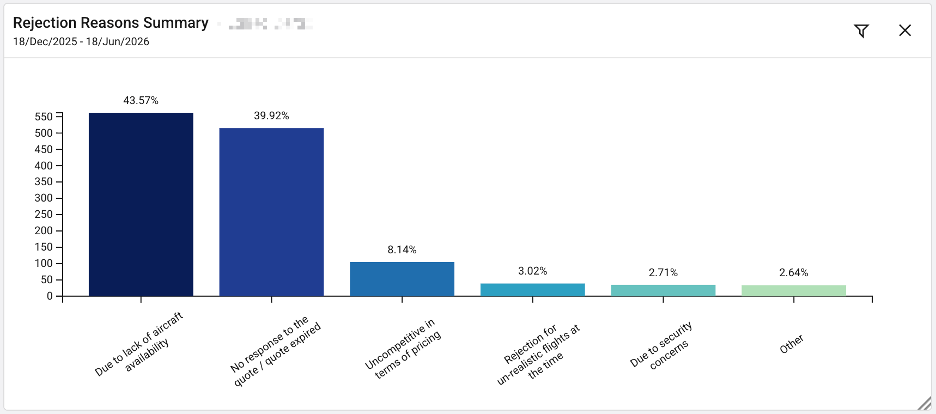
Rejection Reasons Summary
Shows the rejection reason most frequently used with customers over a selected period.
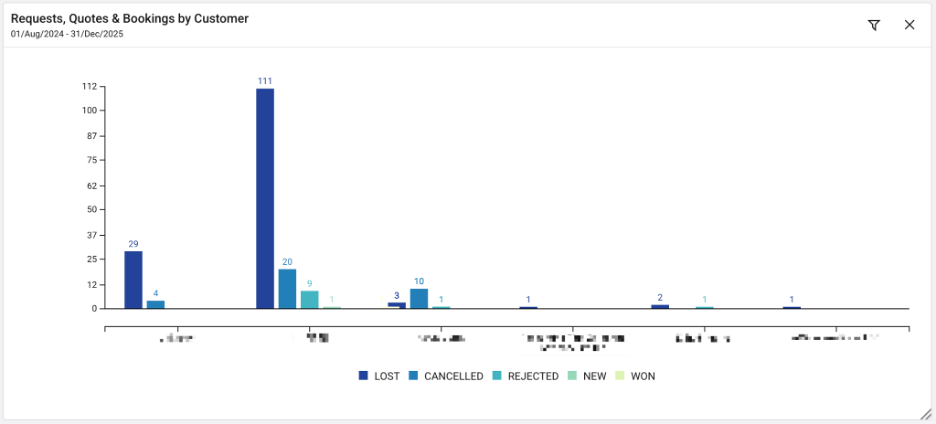
Requests, Quotes & Bookings by Customer
Shows how many requests were created, quoted, and won, filtered by customer.