Pie Charts
Recently we’ve added the tabs with specific pie charts in AWB profit page.
They display the information from the AWB profit grid in graphic way and have three possible options
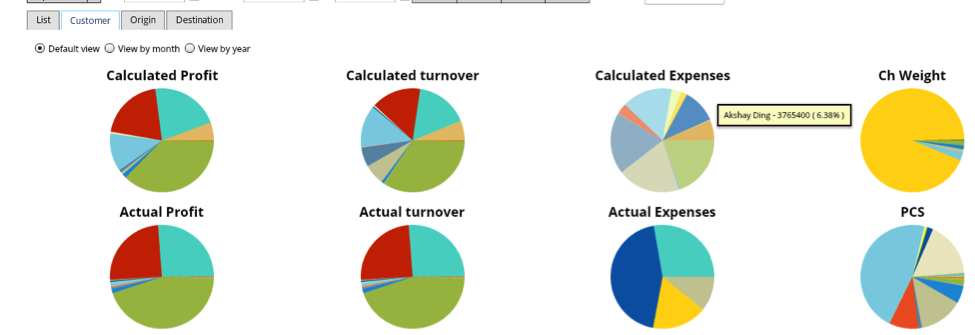
- Divided by customers (each sector corresponds to one of the customer with high contribution in total values)
- Divided by origin

- Divided by destination
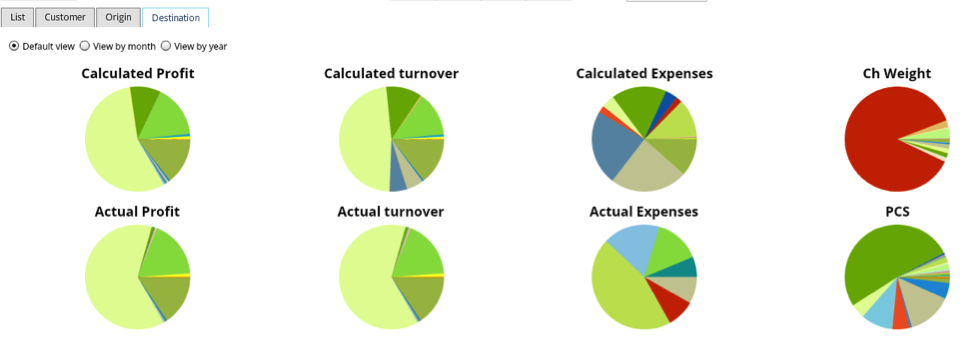
Each of this three option have 8 charts:
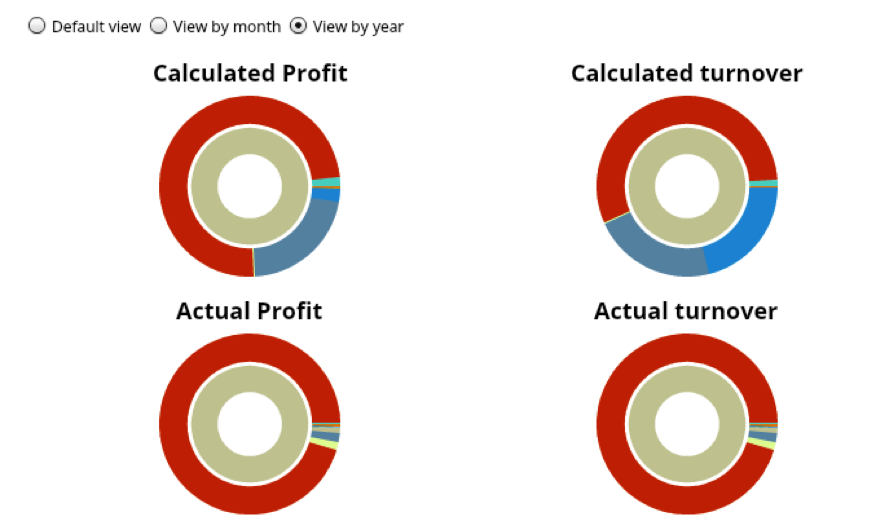
-Actual\calculated profit
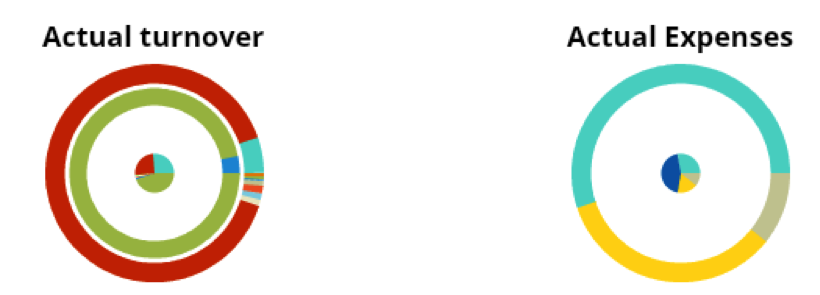
-Actual\calculated turnover(revenue)
-Actual\calculated expenses
-Chargeable weight
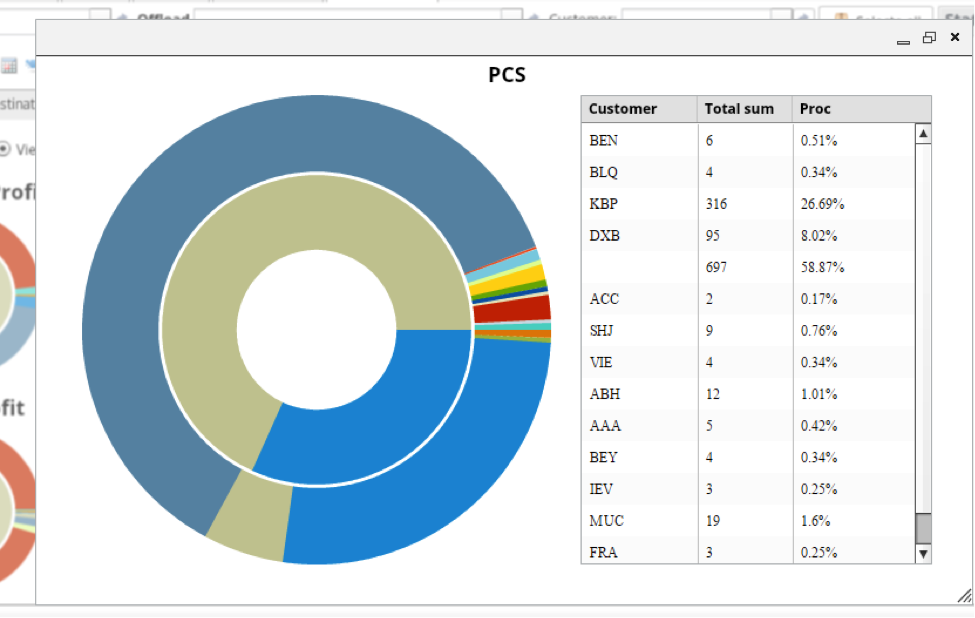
-PCS number
Charts can be displayed in 3 views
-Default will show the values for all filtered period
-Year will split the chart in few parts according to the part of the years that are covered by filters. For example if you filtered 26.07.2014-26.07.2015 it will be divided in 2 parts,
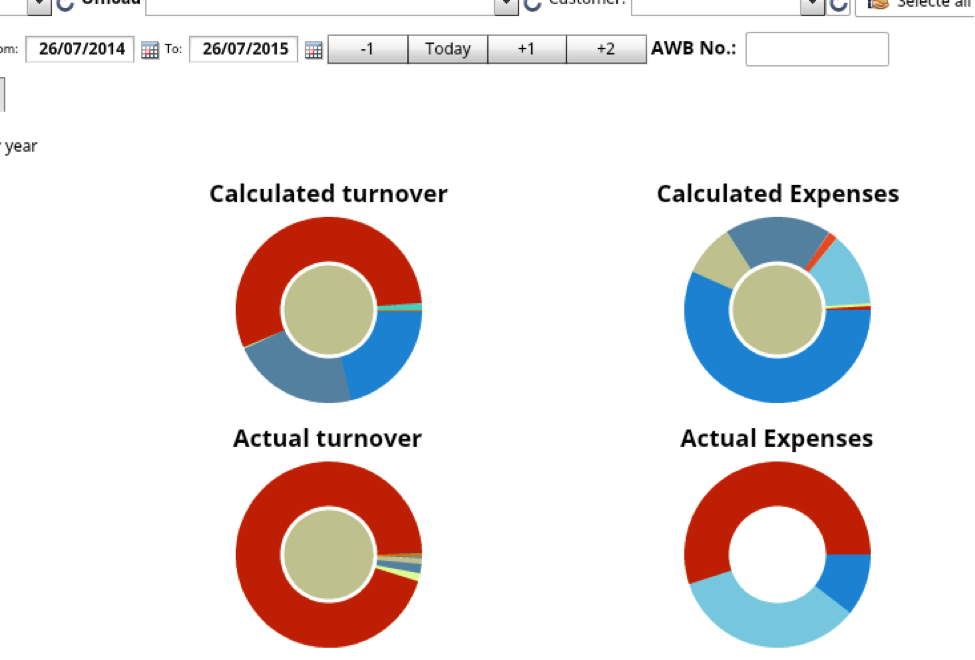
15.01.2013-15.02.2015 in 3 parts etc.
-The same way works for Month view
If one month\year covered by filter have no data it will be missing on chart
Double click on chart will call it’s detailed view with values in the grid