
Homepage→Warehouse→ Inventory Movements→ Inventory Report
This interface allows you to look through the sales of each product in each station. How much was received and how much was spent, the income and the expenses for each product. Using the reports, you will have an opportunity to analyze all sales and draw conclusions about the success of the work
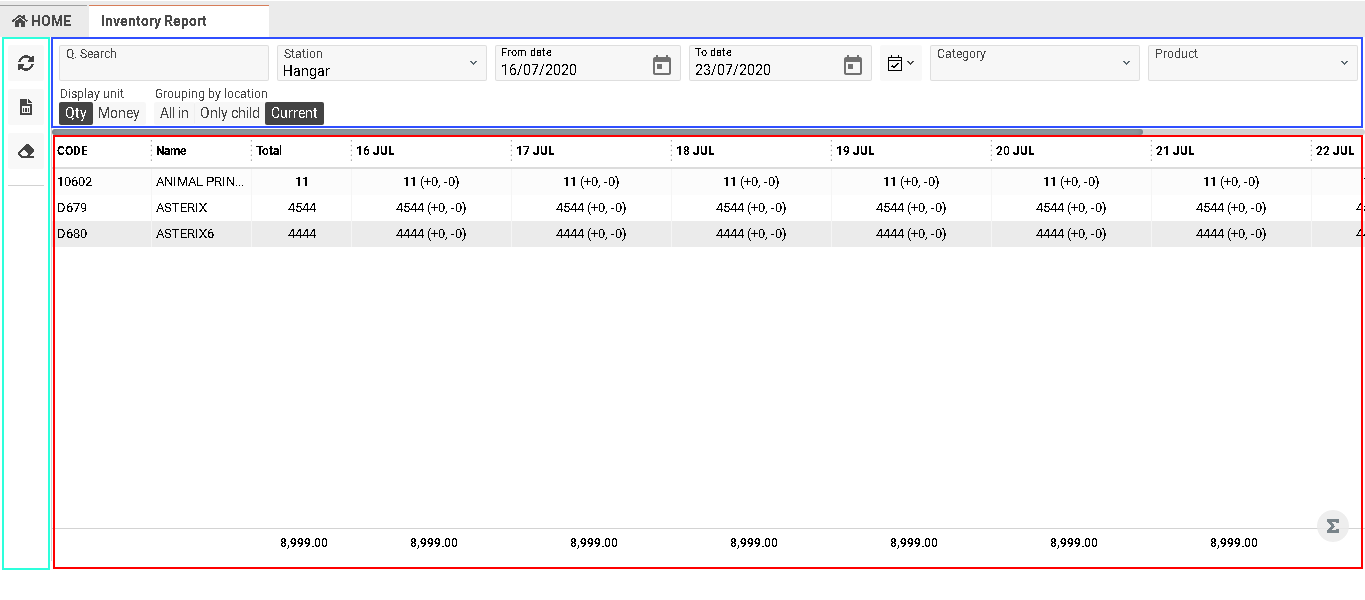
Main interface
-
Blue zone - panel with the main functional
-
Green zone - panel with secondary functional
-
Red zone - information preview
Main functional panel description:
-
Quick Search field allows to filter information displayed in the information preview zone. Available data for filtering: codes, names, total and dates values
-
Station is required for the choosing one of the places/stations where the product is located. Pay attention that the field is required
-
Category and Product fields allows to filter data by additional parameters adjusted via Products list
-
Datepickers allow to set the needed period up. The most popular periods and linear predictions are available with special button

-
Display unit filtration allows to switch between monetary and natural data representation. For monetary representation is used default currency, for natural - unit types (which is set up via Products list)
-
For cases when Station value contains child values interface proposes additional functional - Grouping by locations. This filtration for state All in summarizes entries of current and all child levels, for Only child state summarizes only entries of child levels and Current state filters all entries according to the selected Station value
Secondary functional panel description:
-
Refresh data
-
Clear applied filters
-
Export data with Reports. Reports allow to export data to pdf and xls formats with parameters adjusted on the main functional panel. There are two forms of reports:
-
Daily Sales Report - full information about each product: code, data, opening balance and end-of-period information, full display for each day and final totals
-
Daily Sales Report Short - only information about opening balance, opening average price, opening value, all totals, measuring and categories without display of days
-
Information preview description:
-
Code– the code of the product
-
Name – the name of the product
-
Total – the amount of the product at the end of the selected period. In case the total amount ≤ minimum stock, the text will be highlighted in red.
-
Information is grouped only by the day according to the selected period. Date value contains:
-
The row in the footer of the information preview contains the summarized values by columns
-
Available amount of dates for preview in the interface is limited by 35 columns from the first date of the selected period. For full preview should use Reports function